Every solar panel loses a little efficiency as it ages. The datasheet will quote a linear degradation rate — typically 0.5% to 0.8% per year — and most asset owners file that number away and move on. But in our O&M audits, we repeatedly see plants “ageing” at three to five times the datasheet rate, and almost none of that loss is actually ageing. It is fixable underperformance wearing a degradation label.
The distinction matters financially. A 1 MW rooftop that silently loses 4% of its yield each year is forfeiting tens of thousands of rupees in recoverable generation — every single month it goes undiagnosed. Before you write off that decline as the cost of doing business, it is worth asking whether your panels are actually degrading, or simply underperforming.
Most “degradation” we find in the field isn’t ageing at all — it’s a fault that a technician could fix in an afternoon.
What normal degradation actually looks like
A healthy module degrades slowly and predictably. Crystalline silicon panels typically lose 1% to 2% in the first year as light-induced degradation (LID) stabilises, then settle into a gentle 0.4% to 0.6% annual decline for the rest of their warrantied life. Crucially, that loss is uniform — the entire array sags together, at roughly the same rate, season after season.
That uniformity is the tell. Natural ageing does not create one underperforming row, one hot inverter, or a single string that drops 8% while its neighbours hold steady. If you are seeing non-uniform losses, you are not looking at degradation — you are looking at a fault with a specific address.
When “degradation” is really something else
In practice, a handful of correctable issues are routinely mistaken for panel ageing:
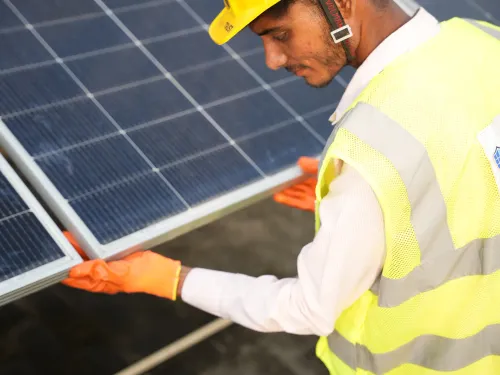
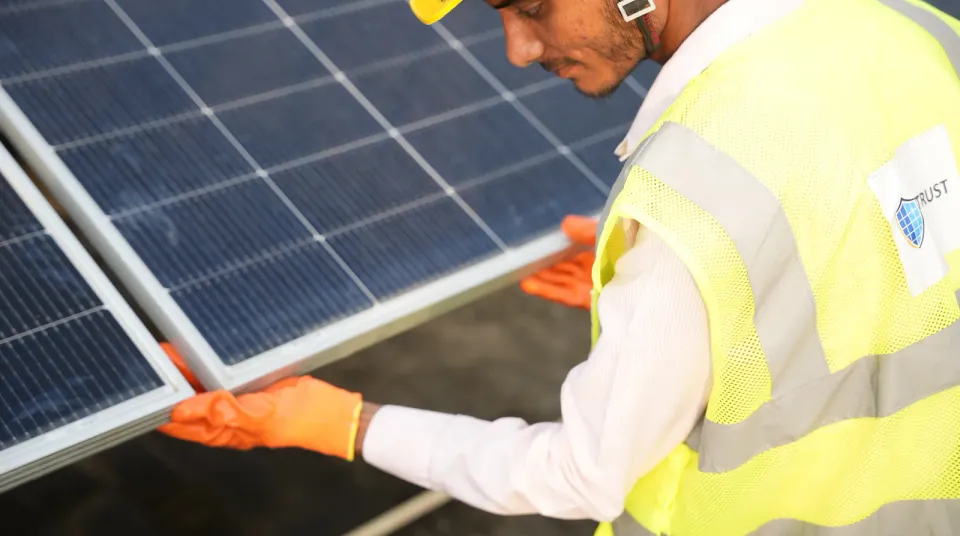
- Soiling and bird droppings — Accumulated dust, and the hard, baked-on residue left by monsoon rains, blocks irradiance exactly like degradation. A single soiled string can read as a 6–8% loss while the panel itself is perfectly healthy.
- Cell mismatch and micro-cracks — Hairline cracks and PID (potential-induced degradation) drive current losses in specific cells, often invisible to the naked eye but obvious to a thermography scan.
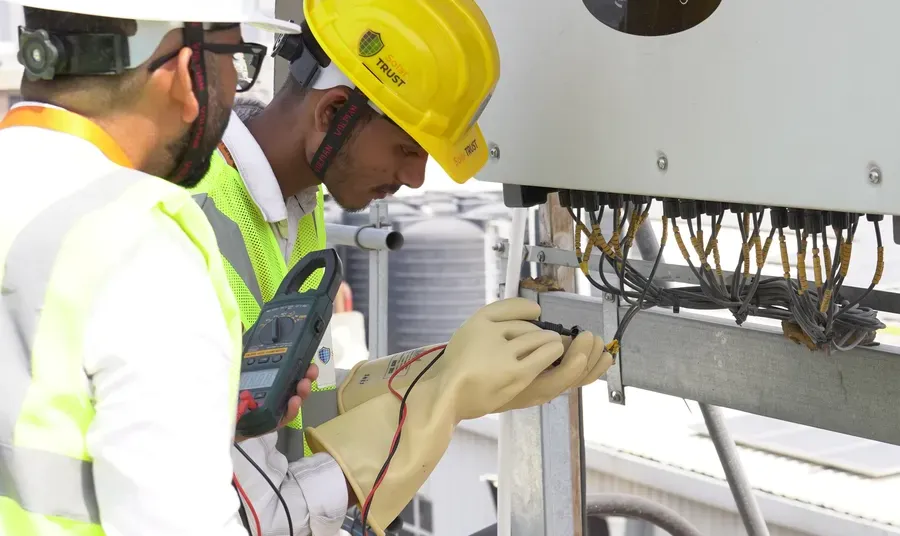
- Wiring and connection losses — Loose MC4 connectors, oxidised terminations, and string-level cable faults quietly bleed DC current and get averaged into a “the panels are getting old” narrative.
- Inverter drift — An inverter running below its MPPT sweet spot, or derating from thermal stress, depresses yield across every string behind it. The panels never see the problem; the owner’s P&L does.
The common thread is that these are recoverable. Panels that are cleaned, re-terminated, or had a failed bypass diode replaced snap back toward their original curve. True degradation never snaps back.
Measure it with the performance ratio, not the CUF
The cleanest way to answer “ageing or underperforming?” is the performance ratio (PR). Unlike CUF — which is sensitive to location, irradiation, and how hard your DC array is overloaded — PR normalises actual output against what the weather and plant design say you should have produced.
A well-run plant should hold a PR of 75% to 85%. When that number drifts downward while soiling, downtime, and grid curtailment are all accounted for, then you can start attributing the remainder to genuine module degradation. Any drop before those factors are ruled out is a guess dressed up as a measurement.
A practical checklist for owners
If your yield is trending down, run through these before you accept ageing as the answer:
- Trend PR, not just generation — Track monthly PR against weather-corrected expectations so you can see the rate of decline, not just the raw number.
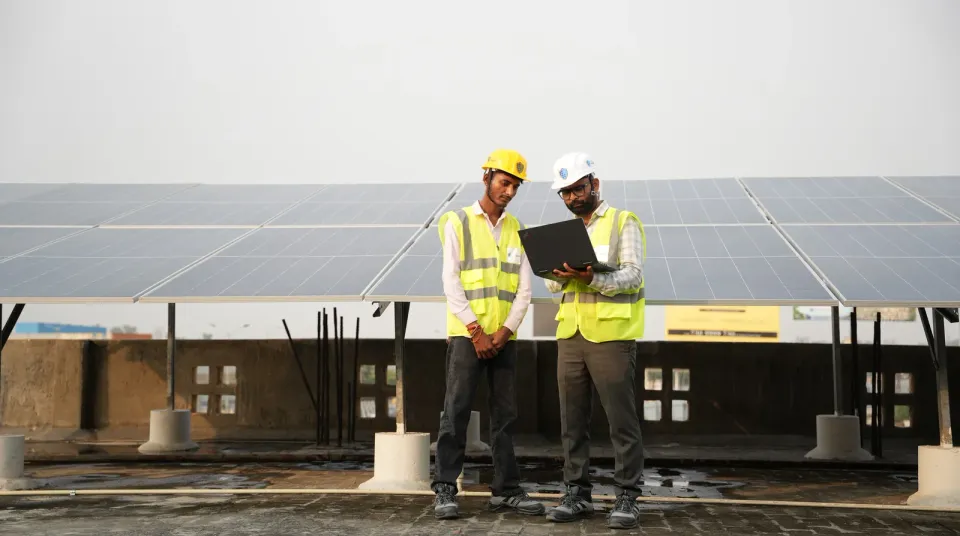
- Look for non-uniform losses — A single underperforming string or row is a fault, not ageing. String-level monitoring makes this visible in minutes.
- Rule out the fixables first — Confirm the cleaning schedule, torque the terminations, and run a thermography scan before attributing loss to the panels.
- Ask your O&M provider for proof — Demand the underlying data behind any “degradation” claim. A responsible provider can show you exactly which strings, cells, or connections are responsible.
Degradation is real, and it does eventually cap every plant’s life. But accepting it too early is how healthy assets end up leaving revenue on the table. Before you budget for the slow decline, make sure the decline you are seeing is actually real — and not a fixable fault in disguise.