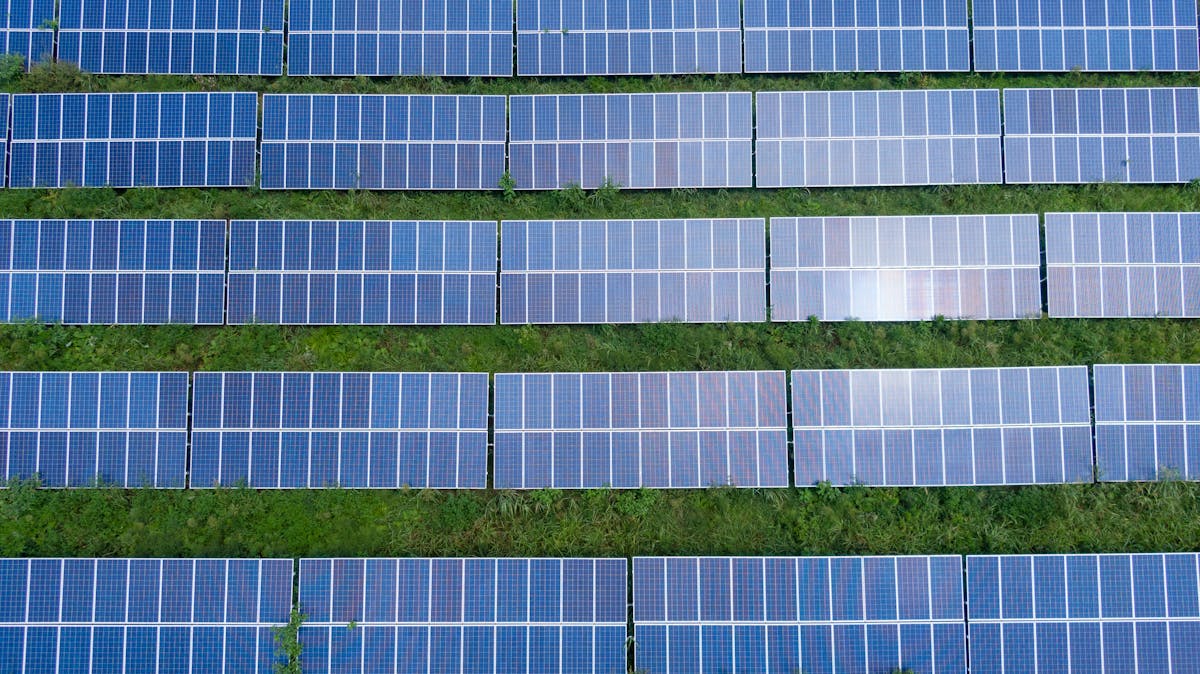
Your solar plant can look perfectly clean and healthy from the ground — and still be losing 15–20% of its potential output to faults that are completely invisible without the right diagnostic tools.
The Problem with Visual-Only Inspections
Your solar plant can look perfectly clean and healthy from the ground — and still be losing 15–20% of its potential output to faults that are completely invisible without the right diagnostic tools.
That is where thermal imaging (thermography) becomes essential. An infrared camera captures the heat signature of every panel and component, revealing issues that only show up as temperature differentials.
What Thermal Imaging Reveals
1. Hotspot Cells
A panel with a cracked cell, partial shading, or soiling creates a hotspot. On a thermal image, these appear as bright orange or red spots against the cooler blue-green background of functioning cells.
Critical threshold: Any hotspot above 10°C above panel ambient temperature requires investigation. Hotspots above 30°C typically indicate a failed bypass diode or broken cell.
2. Bypass Diode Failures
Each panel has 3 bypass diodes that protect individual cell sections from hotspot damage. When a bypass diode fails short-circuit, it causes the entire third of the panel it protects to run hot permanently.
On a thermal image, a failed bypass diode appears as a distinct horizontal band of elevated temperature across one-third of the panel. This is one of the most common faults we find.
3. Soiling Hotspots
Persistent bird droppings create shading hotspots that, if left uncleaned, heat repeatedly through daily thermal cycles and eventually crack the cell underneath.
4. Connector and Cable Faults
Degraded MC4 connectors, loose terminations, and damaged cables all appear as warm spots in thermal imaging. A connector at 60°C when ambient is 30°C indicates significant resistance — a fire risk and generation loss.
5. Junction Box Problems
Junction box temperature anomalies indicate loose connections, water ingress, or diode failures inside the box. Particularly common on panels installed more than 5 years ago.
How We Conduct a Thermal Imaging Audit
Our thermal imaging audits follow IEC 62446-3 guidelines:
- Optimal timing: Audits conducted between 10 AM and 2 PM on clear days with irradiance above 700 W/m2
- Equipment: FLIR thermal cameras calibrated to ±2°C accuracy
- Coverage: Every panel in the plant is imaged from an optimal angle
- Classification: Findings classified by severity — Category A (immediate action), Category B (within 30 days), Category C (monitor at next visit)
- Report: Written report with annotated thermal images and prioritized action items
Typical Findings Across Our Audit Portfolio
Across thermal imaging audits conducted in Delhi NCR:
- 62% of plants had at least one hotspot requiring attention
- 38% had at least one failed bypass diode
- 71% had at least one connector showing elevated temperature
- 29% had junction box anomalies
For plants that had never had a thermal audit, the average hidden generation loss identified was 9.3%.
Thermal Imaging Is Included in Our Annual Safety Audits
All SolarTrust AMC plans include an annual thermal imaging audit. For clients not yet on an AMC, we offer standalone performance audits that include full thermographic analysis.
Book a free 30-point assessment to start understanding what your plant is currently losing.